December 20, 2013
Long Ridge of Tennessee Valley Divide
Other Colors Of The Season - Morning Sunrise
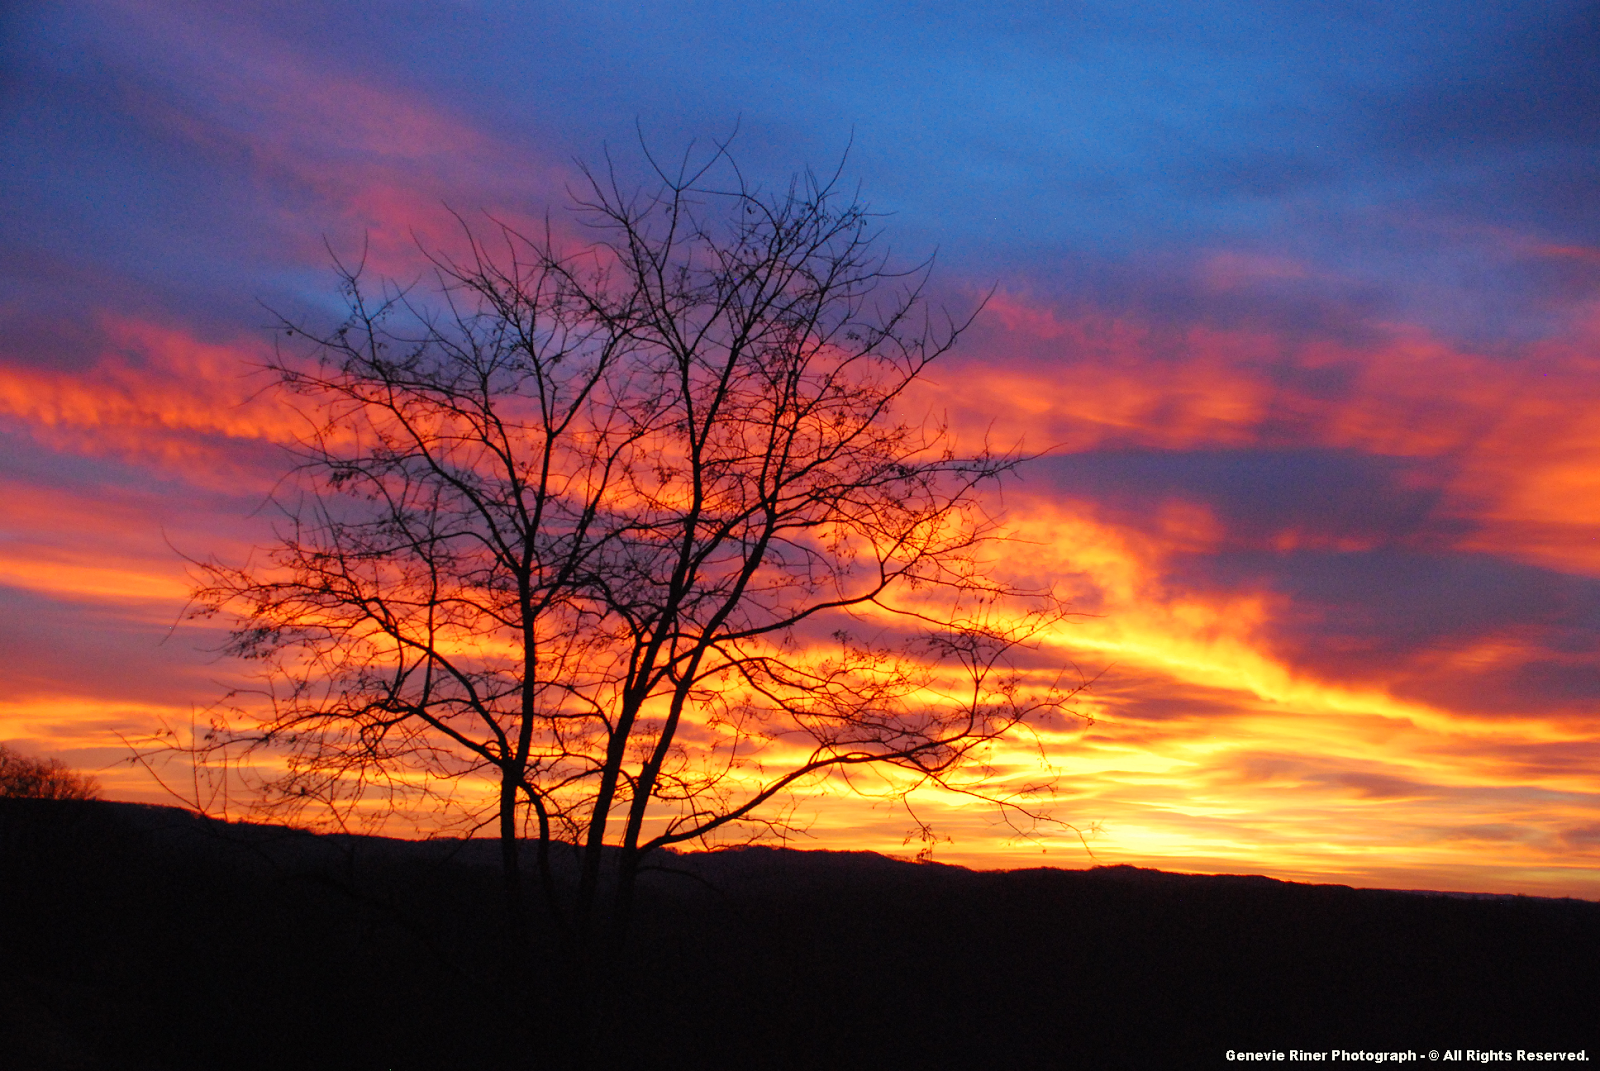
Photograph by Genevie Riner - © All Rights Reserved.
A spectacular sunrise above the Cumberlands
was captured by photographer Genevie Riner amid early hours of December 20, in advance of one of the numerous storm systems observed during this wet and stormy month.
was captured by photographer Genevie Riner amid early hours of December 20, in advance of one of the numerous storm systems observed during this wet and stormy month.
Climate Statistics
For December 2013
( Lower Elevations of Russell Fork Basin )
Clintwood 1 W - Elevation 1560 feet
Average Daily MAX: 45.9 degrees
Average Daily MIN: 25.2 degrees
MEAN: 35.6 degrees
Highest Temperature: 69 degrees
Lowest Temperature: 12 degrees
Total Precipitation: 6.99"
Total Snowfall: 1.4"
2013 Precipitation: 52.04"
2013 Snowfall: 36.2"
2013 Snowfall: 36.2"
( Northern Base of High Knob Massif )
City of Norton - Elevation 2141 feet
Average Daily MAX: 43.0 degrees
Average Daily MIN: 24.3 degrees
MEAN: 33.6 degrees
Highest Temperature: 65 degrees
Lowest Temperature 8 degrees
Total Precipitation: 8.85"
Total Precipitation: 8.85"
Total Snowfall: 1.2"
2013 Precipitation: 64.15"
2013 Snowfall: 52.2"
2013 Precipitation: 64.15"
2013 Snowfall: 52.2"
( Along the Tennessee Valley Divide )
Nora 4 SSE - Elevation 2650 feet
Average Daily MAX: 43.6 degrees
Average Daily MIN: 29.8 degrees
MEAN: 36.7 degrees
Highest Temperature: 66 degrees
Lowest Temperature: 14 degrees
Total Precipitation: 6.79"
Total Snowfall: 1.8"
2013 Precipitation: 58.99"
2013 Snowfall: 46.7"
2013 Snowfall: 46.7"
December 2013 ended having produced milder than average temperatures, much above average precipitation and MUCH, MUCH below average snowfall across the High Knob Landform and southern Appalachians.
850 MB Across The USA
December 1 to December 29, 2013
Air Temperature Composite Anomalies

November 2013 had more snowfall than December to oppose the natural trend of climatology that typically features much more December snow.
The big picture was dominated by a powerhouse polar vortex whose tight circulation forced repeated intervals of SW upper air flow across mid-latitudes, especially the Eastern-Southeastern USA and southern Appalachians.
Northern Hemisphere
The Stratospheric Polar Vortex
December 1 to December 29, 2013
10 MB Geopotential Height Anomalies

United States
December 1 to December 29, 2013
500 MB Vector Wind Anomalies

White Christmas Eve-Morning
Localized In Virginia Mountains
History Of Christmases Past ( 1963-2011 )
Despite the lack of December snow, compared
to climatology, enough fell to produce a white Christmas Eve Day & Christmas Morning period across higher elevations of Wise & Dickenson counties ( as well as the Burkes Garden area of Tazewell County & Mount Rogers-Whitetop of Washington-Grayson counties ).
December 24, 2013 at 1:28 PM
University of Virginia's College In Wise

The heaviest snow in Virginia likely fell amid a rather well developed snowstreak from heads of Guest & Powell rivers southeast into the Wise Plateau, including the Hurricane-Dotson Creek communities.
December 24, 2013 at 12:44 PM
Snow Covered Roads Across Wise Plateau

December 24, 2013 at 1:00 PM
A White Christmas In Wise County, Virginia

Winter wonderland conditions were on display amid highest elevations in the High Knob Massif which missed the main snowstreak but still managed to accumulate upslope snow & rime.
December 24, 2013 at 1:27 PM
Eagle Knob of High Knob Massif
It was a cold Christmas Holiday with temperatures dropping from 26 to 8 degrees in the City of Norton between the beginning of Christmas Eve day and Christmas Morning.
December 24, 2013
City of Norton Automated Weather Station

December 25, 2013
City of Norton Automated Weather Station

Minimum temperatures, of course, also dropped
into single digits amid the High Knob Massif.
December 24, 2013 at 1:28 PM
Eagle Knob of High Knob Massif
Among the last spectacular sunrises of 2013 was captured by photographer Wayne Riner during morning hours of December 28, as wave clouds formed in advance of the next big storm system.
December 28, 2013
Long Ridge of Tennessee Valley Divide
Golden Morning Through The Trees

Yet another heavy rain, wind, fog event followed into December 28-29 before a transition back to winter with light snow & icy fog again coating the High Knob Massif to close out 2013.
December 30, 2013 at 11:16 AM
Eagle Knob of High Knob Massif
Major Changes Forced
By Powerful Wave Activity
January Departs From December Regime
( But More SW Flow Likely At Times )
A couple of bitter surges of arctic air are
coming during this first week of January 2014.
The bitter blasts are centered around:
January 2-4
This has potential to produce 0 to 10 degree
readings, with sub-zero values possible after
snow accumulation if winds calm & skies clear
( Wind Chills will go well below zero )
January 6-8
This has extreme potential with the coldest
air mass since the mid 1980s to mid 1990s
( Temps will plunge Jan 6 to below zero )
While the Polar Vortex is not itself moving south into the USA, at least not yet, blobs of bitter air from within its barbaric mass of coldness are literally being squeezed out of it like happens
when you squeeze a tube of toothpaste.
An Analogy
When you squeeze both sides of a tube of toothpaste some paste squirts out the end from the pressure of your fingers pushing on each side, which contract inward and in the process force paste to move out the end of the tube. If the toothpaste tube had an opening on the other end, some would also go out in the opposite direction.
The Polar Vortex has been under a significant Wave 2 attack, triggered by a positive Mountain Torque event across Eastern Asia, over the Himalayas, with push being exerted against the vortex from both the Atlantic side and Pacific side.
Reference Upcoming Wave Forcing Section
Reference State
ECMWF Model Analysis
7:00 AM December 22, 2013
Northern Hemisphere 400K Potential Vorticity

Note how the vortex shape amid the lower stratosphere has changed over time from December 22 ( above ) to December 31
( below ), and how the potential vorticity field became elongated and "squeezed" toward both ends. Waves from both sides, thus a Wave 2, have been causing compression ( squeeze ) to occur.
ECMWF Model Analysis
7:00 AM December 31, 2013
Northern Hemisphere 400K Potential Vorticity

On the Atlantic Ocean side the push on the Polar Vortex is weak at the bottom but strong at the top, in contrast, on the Pacific side the push against the vortex is strong at the bottom and weaker at the top such that the vortex is being vertically tilted and squeezed in the middle thru a depth of atmosphere ( the vertical tilt along a horizontal line not visible on these "flat" graphics ).
This process is also clearly
visible at the 100 MB level
ECMWF Model Analysis
7:00 AM December 22, 2013
Northern Hemisphere 100 MB
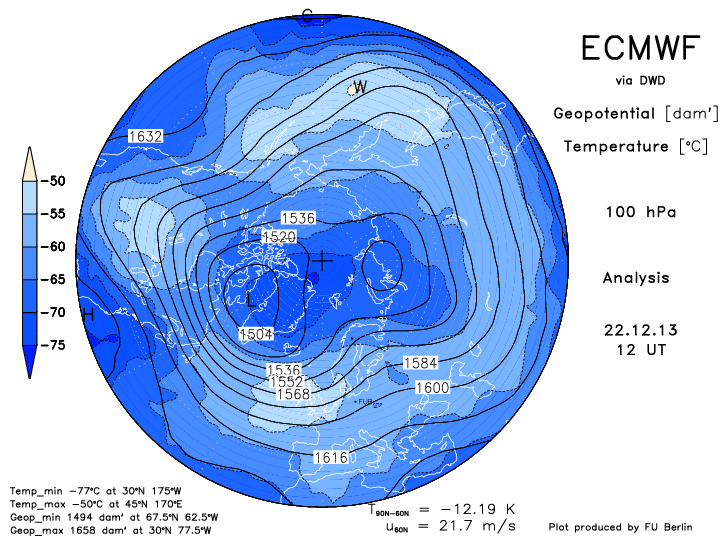
Observe the changes between
December 22 & December 31
ECMWF Model Analysis
7:00 AM December 31, 2013
Northern Hemisphere 100 MB

Look at the 100 MB charts
centered around the times for
the major arctic surges
ECMWF Model Forecast
7:00 AM January 3, 2014
Northern Hemisphere 100 MB

Note that the vortex, which has been very strong, will likely reform and stimulate another surge of enhanced SW Upper Air Flow in middle latitudes to keep a wild UP and Down temperature regime going.
7:00 AM January 7, 2014
Northern Hemisphere 100 MB

While the first week of January 2014 will
feature a couple of arctic surges, the second being EXTREME, the potential of a mid-late January major warming event in the stratosphere is increasing such that more prolonged, extreme conditions could follow renewed intervals of
SW Upper Air flow. Trends to monitor.
Analysis Of Wave Forcing
A Major Sudden Stratospheric Warming Possible
( Split Vortex Type ) By Mid-Late January
The troposphere and stratosphere are intimately coupled, such that the stratosphere should no longer be seen as merely a passive absorber of waves generated within the troposphere.
Eliassen–Palm Flux Vectors
Total Wave For Troposphere + Stratosphere

Both direction ( toward the North Pole = more favorable for vortex weakening and toward the Equator = less favorable for vortex weakening unless reflected by critical layers ) and magnitude ( longer = stronger and shorter = weaker ) are important with respect to EP-Flux Vectors, which indicate enhanced, deep vertical forcing through the troposphere and stratosphere in recent days.
Eliassen–Palm Flux Vectors
Total Wave For Stratosphere

While the above is a composite of all waves,
Wave 2 is currently most potent.
7:00 AM December 31, 2013
Geopotential Forcing Of Wave 2

The strength of Wave 1 & Wave 2 forcing can be followed daily on ECMWF Model analysis since the vertical component of wave forcing is illustrated by Heat Flux while their meridional component is illustrated by Momentum Flux.
ECMWF Model Analysis
7:00 AM December 31, 2013
Zonal Mean Heat Flux of Wave 2

ECMWF Model Analysis
7:00 AM December 31, 2013
Zonal Mean Momentum Flux of Wave 2

The strength of current wave forcing along with forecasts of significant activity to continue during the next 1-2 weeks now has some extended range models, like the CFSv2 and GFS, forecasting a major SSW event of the split vortex type by mid-late January.
While tropsopheric results of past SSW events have varied, much like each SSW possessed a unique evolution, the implication of splitting the large mass of barbaric coldness developed this year over Canada could certainly produce extreme conditions over a much more prolonged period for some region or regions.
Split Vortex SSW events tend to have more pronounced impacts upon the north-central Pacific sector which could be important this year if +PNA was promoted for troughing into eastern USA.
A New Look At SSW - Part 1: Climatology
The SSW Of The Arctic Winter 2009-10
This section is under construction. Check back for updates.


