January 22, 2014
Upper Elevations of High Knob Massif
Rime Forest Amid Bitter Cold of Mid-Winter
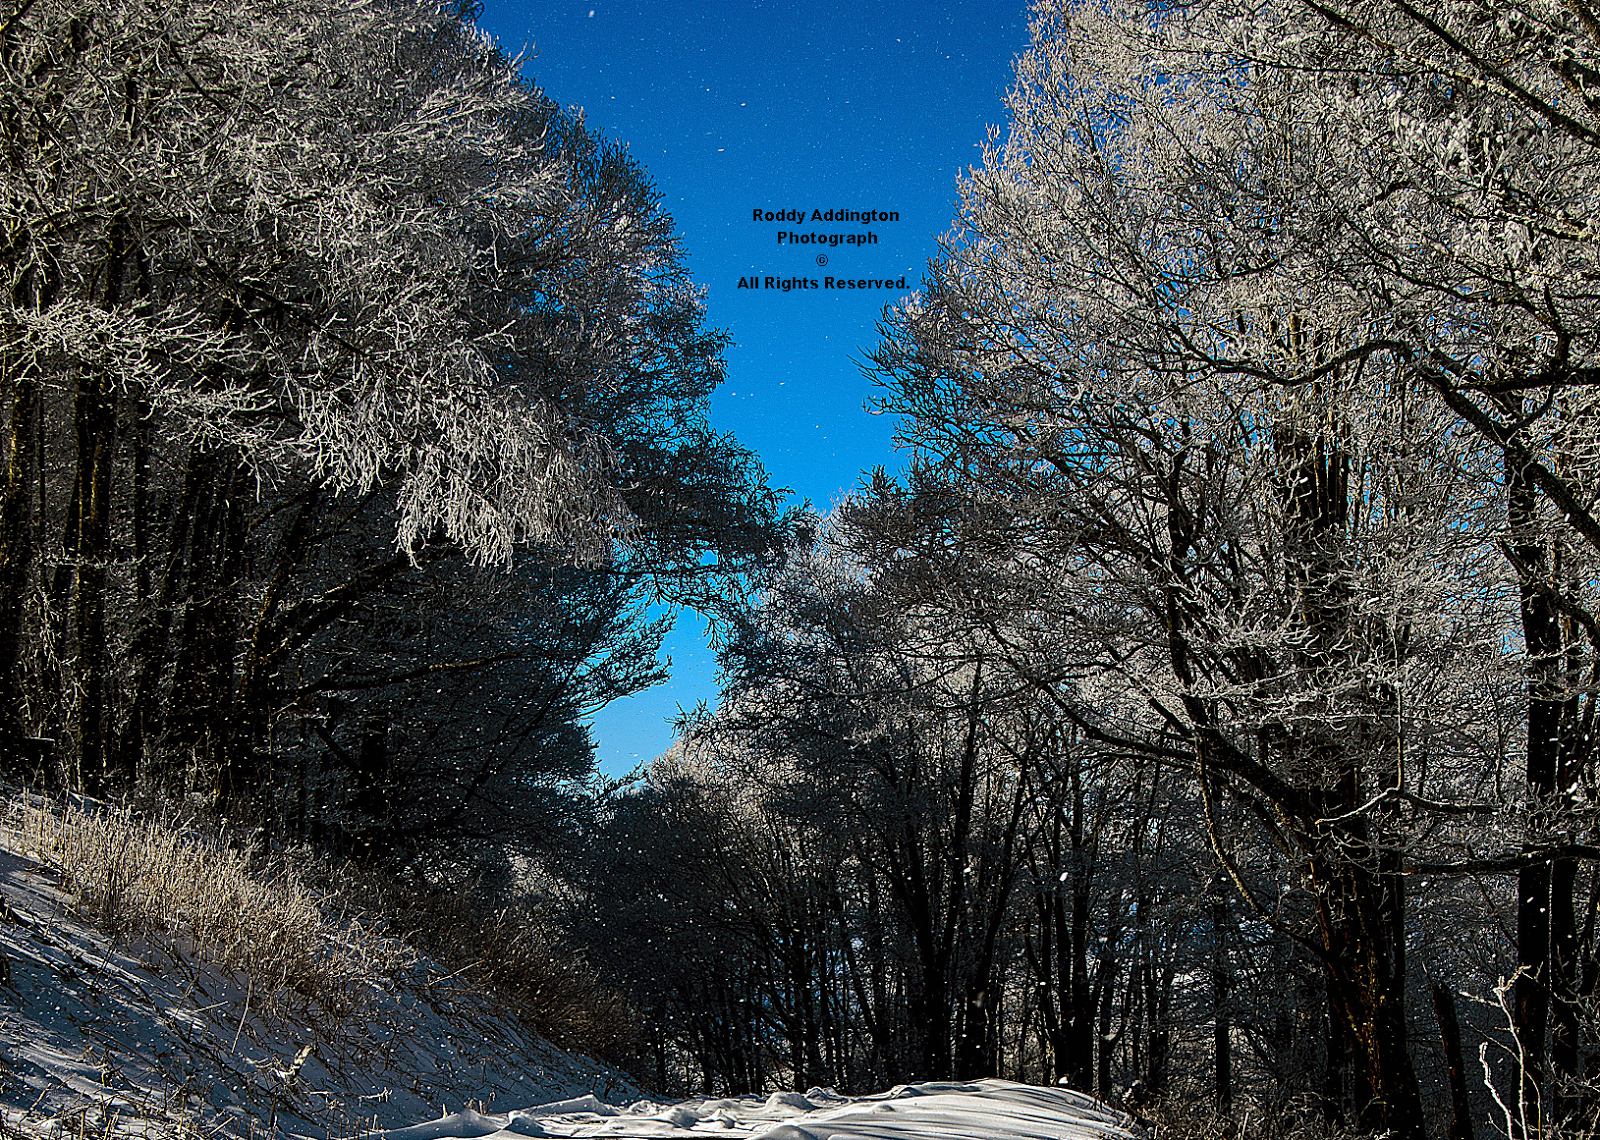
Photograph by Roddy Addington - © All Rights Reserved.
The final month of meteorological winter featured a major snowstorm sandwiched between chaotic, up and down temperatures from beginning to end.
Climate Statistics
For February 2014
( Lower Elevations of Russell Fork Basin )
Clintwood 1 W - Elevation 1560 feet
Average Daily MAX: 44.4 degrees
Average Daily MIN: 22.1 degrees
MEAN: 33.2 degrees
Highest Temperature: 70 degrees
Lowest Temperature: 12 degrees
Total Precipitation: 3.94"
Total Snowfall: 20.9"
( Northern Base of High Knob Massif )
City of Norton - Elevation 2141 feet
*Average Daily MAX: 41.9 degrees
Average Daily MIN: 20.8 degrees
MEAN: 31.4 degrees
Highest Temperature: 65 degrees
Lowest Temperature: 9 degrees
Total Precipitation: 5.15"
Total Snowfall: 18.4"
( Along the Tennessee Valley Divide )
Nora 4 SSE - Elevation 2650 feet
Average Daily MAX: 41.5 degrees
Average Daily MIN: 24.3 degrees
MEAN: 32.9 degrees
Highest Temperature: 67 degrees
Lowest Temperature: 13 degrees
Total Precipitation: 3.66"
Total Snowfall: 14.6"
*Average Daily MAX of 40.0 degrees
at the City of Norton Water Plant.
The coldest temperatures of February 2014 came at the end of the month, ironically after the extensive mid-month snowpack had mostly melted away, with single digits during February 27-28 at mid-upper elevations in the High Knob Massif area.
The coldest temperatures of February 2014 came at the end of the month, ironically after the extensive mid-month snowpack had mostly melted away, with single digits during February 27-28 at mid-upper elevations in the High Knob Massif area.
January 30, 2014
Lower Portion of Middle Elevations
Little Stony Creek of High Knob Massif
Frozen Upper Falls of Little Stony Gorge

Meteorological Winter
Climate Statistics 2013-14
( December-February )
( Lower Elevations of Russell Fork Basin )
Clintwood 1 W - Elevation 1560 feet
Average Daily MAX: 42.2 degrees
Average Daily MIN: 19.6 degrees
Winter MEAN: 30.9 degrees
Highest Temperature: 70 degrees
Lowest Temperature: -6 degrees
Total Precipitation: 13.13"
Total Snowfall: 38.1"
( Northern Base of High Knob Massif )
City of Norton - Elevation 2141 feet
Average Daily MAX: 39.4 degrees
Average Daily MIN: 18.1 degrees
Winter MEAN: 28.7 degrees
Highest Temperature: 65 degrees
Lowest Temperature: -13 degrees
Total Precipitation: 17.40"
Total Snowfall: 40.4"
( Along the Tennessee Valley Divide )
Nora 4 SSE - Elevation 2650 feet
Average Daily MAX: 39.6 degrees
Average Daily MIN: 22.6 degrees
Winter MEAN: 31.1 degrees
Highest Temperature: 67 degrees
Lowest Temperature: -10 degrees
Total Precipitation: 12.93"
Total Snowfall: 33.9"
Colder places in the High Knob Massif varied between mid 30s by day to mid 10s at night to generate Winter MEAN temperatures in the middle 20s. Colder than average but not nearly as cold as the worst winters on record in the massif area.
January was most notable for extreme coldness, with average MINS ranking among the coldest observed
since the late 1970s.
Domain Of The Cold Places & January 2014 Stats
The general 18.00-20.00"+ of total precipitation came in a little below the average of the past
6 winter seasons, with January being the
driest month of the period in the massif.
The 6 feet of snow that fell at the summit level of the High Knob Massif during this three month period fell almost entirely in January-February
( with only 4" during December ).
Approximately 66% of days had 1" or more of snow depth on north slopes of High Knob Lake Basin ( and adjoining basins ) during the December-February period. Average snow depths reached up to 12"+ in late January and 2 feet during mid-February ( above 3300 feet ).
February 16, 2014
High Knob Massif Crest Zone
Looking Across Big Cherry Lake Basin

Monthly Precipitation Totals
Big Cherry Dam of High Knob Massif
Observer: Gary Hampton & Staff of Big Stone Gap WP
December: 8.38"
January: 4.68"
February: 6.16"
Total: 19.22" ( M )*
14-Month Total: 85.22" ( M )
*The NWS rain gauge busted due to extreme coldness in January with the late January-February total being partially based upon an automated IFLOWS rain gauge at the Dam ( with missing data ).
( M ): Actual total is estimated to be around 90.00" with missing moisture in snow too deep for the rain gauge to physically contain and between hand-measurements at the Dam throughout the year ( averaging 1 measurement per week ).
It is always interesting to note
that climate is relative to location.

If the Tri-Cities had experienced the same temperatures and snowfall as the City of Norton, for example, the December-February period of meteorological winter would have been their coldest & snowiest since record keeping
began in 1937. Amazing!
Meteorological Winter
The Big Picture View of 2013-14
( December 1, 2013 to February 28, 2014 Period )
There were a couple of big weather pattern drivers during the meteorological winter period of 2013-14.
1 ). A Polar Vortex with a MEAN position centered between Hudson Bay & Greenland.
Mean Position of Polar Vortex
December 1, 2013 to February 28, 2014

2 ). Persistently positive sea surface temperature anomalies from the northeastern Pacific Ocean into the Arctic Ocean.
Sea Surface Temperature Anomalies
December 1, 2013 to February 28, 2014

The result was mean ridging over the eastern Pacific Ocean and mean troughing over the
central-eastern USA.
Northern Hemisphere
December 1, 2013 to February 28, 2014
500 MB Geopotential Height Composite Anomalies

These are shown graphically by positive 500 MB height anomalies over the eastern Pacific and Arctic oceans
( ridging ) and negative 500 MB height anomalies over much of the northern-eastern USA, Canada, and
northern Atlantic Ocean ( troughing ).
Centered On The United States
December 1, 2013 to February 28, 2014
500 MB Geopotential Height Composite Anomalies

Since the High Knob Landform and southern Appalachians were on the southeastern fringe of mean 500 MB troughing, upstream of the trough axis, MEAN air flow anomalies were WSW-SW in the 850-500 MB layer.
Centered On The United States
December 1, 2013 to February 28, 2014
850 MB Vector Wind Composite Anomalies

Large-scale drivers were such that changes in phase of the PNA teleconnection had the greatest influence on the southern Appalachians, which were often on the CUSP of worse conditions to the north, with +PNA periods having a high correlation to wintry conditions verses
-PNA phases and milder intervals.

The general correlation to observed conditions and PNA phases is illustrated below, with some overlap as such features as the strong Canadian polar vortex + local snowpack worked to sustain January coldness
following a switch back to -PNA.
Correlation To PNA Phase Changes

The persistently -EPO acting to modulate otherwise unfavorable ( for harsh winter ) +NAO and +AO teleconnection phases.
Centered On The United States
December 1, 2013 to February 28, 2014
500 MB Vector Wind Composite Anomalies

The December-February period was colder than average but not exceptionally so amid the southern Appalachians.
Centered On The United States
December 1, 2013 to February 28, 2014
850 MB Air Temp Composite Anomalies

Exceptional coldness verses climatology was found between the Ohio River & central Canada, where mean air temperature anomalies during the period of December-February were the greatest in the Northern Hemisphere.
With respect to long-term climatology, Ohio River Valley cities from Huntington, Wv., to Cincinnati, Oh., have had a more severe winter season than many mountain towns and peaks along the southern-central Appalachians.
The 45.8" of snow observed so far this season in Cincinnati, for example, is 231% of average
( i.e., more than double what typically falls ).
Meanwhile, seasonal snow totals from Snowshoe Mountain to the High Knob Massif are only running around average for this point in the season ( although they have been 2-3 times that observed in Cincinnati, with respect to climatology the worse winter verses
what typically falls has been in Cincinnati ).
Northern Hemisphere
December 1, 2013 to February 28, 2014
850 MB Air Temp Composite Anomalies

Height & Temperature Anomalies
Month by Month Breakdown
A month by month breakdown reveals that anomalous January coldness was partially offset by December mildness, preventing the meteorological winter period of 2013-14 from reaching "great" status in the southern Appalachians...at least,
with respect to mean temperatures
( the season is NOT over YET ).
The southern Appalachians could have likely obtained "great" status with respect to winter temperatures had the NAO and AO teleconnection phases been negative in the mean, forcing the 500 MB trough farther south and southeast ( i.e., creating a MUCH more severe winter along the mountain chain with respect to coldness ).
Case in point being the historic winter
seasons of 1976-77 and 1977-78.
Northern Hemisphere
December 1, 1976 to February 28, 1977
500 MB Geopotential Height Composite Anomalies

Both of these winter seasons had strongly negative phases of AO & NAO and corresponding mean 500 MB trough anomalies centered along the Appalachians
( to sustain prolonged, harsh winter conditions ).
Northern Hemisphere
December 1, 1977 to February 28, 1978
500 MB Geopotential Height Composite Anomalies

500 MB Height Anomalies
December-February 2013-14
Northern Hemisphere
December 1-31, 2013
500 MB Geopotential Height Composite Anomalies

Northern Hemisphere
January 1-31, 2014
500 MB Geopotential Height Composite Anomalies

Northern Hemisphere
February 1-28, 2014
500 MB Geopotential Height Composite Anomalies

850 MB Temp Anomalies
December-February 2013-14
Northern Hemisphere
December 1-31, 2013
850 MB Air Temp Composite Anomalies

Northern Hemisphere
January 1-31, 2014
850 MB Air Temp Composite Anomalies

Northern Hemisphere
February 1-28, 2014
850 MB Air Temp Composite Anomalies

The Bottom Line...
The upper Midwest, Great Lakes, and northern Plains had a brutal December-February period of meteorological winter with more variable, UP and DOWN winter conditions to the south, especially along the southern-central Appalachians.
Since the PNA teleconnection was partially forced by persistent Pacific SST anomalies and the eastern Canada polar vortex, it is not surprising that PNA phase changes played important roles in observed conditions during meteorological winter across the southern Appalachians ( which were often on the CUSP of worse conditions to the north ).
Despite model forecasts of barbaric conditions throughout much of December 2013, severe conditions could not develop south of the Ohio River ( in any harsh, sustained fashion ) until the PNA phase changed to positive to support such conditions. The subsequent development of
local-regional snowpack allowed bitter January conditions to continue for a while after the PNA phase changed back to negative.
Eventually, the -PNA in combination with +NAO and other teleconnection phases unfavorable for sustaining harsh conditions gave way once again to an UP & DOWN pattern in which the worse winter conditions in the southern Appalachians became associated with periodic +PNA intervals
( e.g., mid-February and early March ).
Links To Previous Sections
Winter Storm Buries The High Knob Landform
Mountain Waves - Snapshots From A Single Day
Domain Of The Cold Places & January 2014 Stats
Wicked Conditions In The High Knob Massif
Wave Clouds Above The High Knob Landform
Wet Winter Pattern Of 2013-14
Arctic Cold Waves Of Early January 2014
Wet December 2013 - A New Pattern Ahead
The Stormy Pattern Of December 2013
White Thanksgiving Closes November 2013
Early Season Arctic Blast - November 2013
The Colorations Of Autumn 2013


